
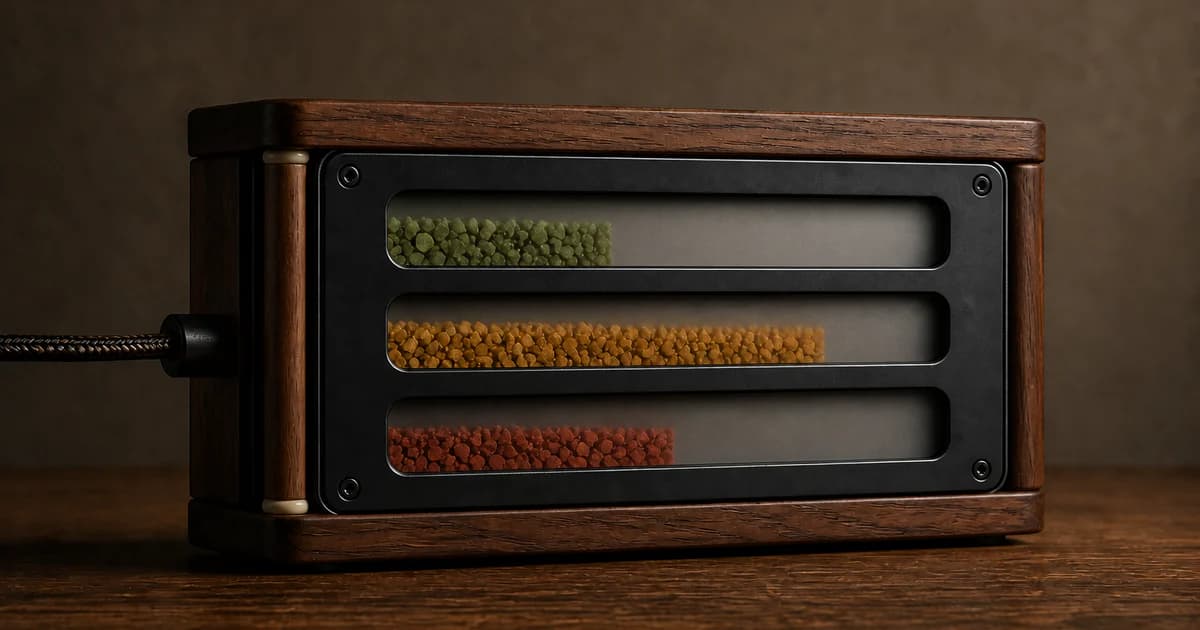
Claude Code has a hidden status line feature. It pipes rich JSON data to a shell script — including rate limits, context usage, and session cost. I turned it into a Gruvbox-themed dashboard.
The Feature Nobody Talks About
Json
{
  "statusLine": {
    "type": "command",
    "command": "bash ~/.claude/statusline-command.sh"
  }
}
The JSON Input
Json
{
  "context_window": {
    "used_percentage": 35,
    "remaining_percentage": 65,
    "context_window_size": 200000
  },
  "rate_limits": {
    "five_hour": {
      "used_percentage": 81,
      "resets_at": 1774872000
    },
    "seven_day": {
      "used_percentage": 6,
      "resets_at": 1775458800
    }
  },
  "cost": {
    "total_cost_usd": 2.25,
    "total_duration_ms": 5019860
  },
  "model": {
    "display_name": "Opus 4.6",
    "id": "claude-opus-4-6"
  },
  "workspace": {
    "current_dir": "/Users/me/project"
  },
  "session_id": "abc123",
  "version": "1.x.x"
}
What I Built
Text
[Opus 4.6 (200k context) | Max]  |  ~/project git:(main*)  |  session-name
Context ████░░░░░░ 35%  |  Usage ████████░░ 81% (resets 2h 40m)  |  ░░░░░░░░ 6% (resets 6d 3h)
3 CLAUDE.md | 4 MCPs | 10 hooks | 1h 23m | $2.25
- Context: how much of the context window you've used
- 5h Usage: rolling 5-hour rate limit (the one that actually throttles you)
- 7d Usage: rolling 7-day rate limit
The Script
Extracting Rate Limits
Bash
rl_5h_pct=$(echo "$input" | jq -r '.rate_limits.five_hour.used_percentage // 0')
rl_5h_reset=$(echo "$input" | jq -r '.rate_limits.five_hour.resets_at // 0')
rl_7d_pct=$(echo "$input" | jq -r '.rate_limits.seven_day.used_percentage // 0')
rl_7d_reset=$(echo "$input" | jq -r '.rate_limits.seven_day.resets_at // 0')
Reset Countdown
Bash
fmt_reset() {
  local reset_ts=$1
  local now=$(date +%s)
  local diff=$(( reset_ts - now ))
  [ "$diff" -lt 0 ] && diff=0
  local h=$(( diff / 3600 ))
  local m=$(( (diff % 3600) / 60 ))
  if [ $h -gt 0 ]; then
    echo "${h}h ${m}m"
  else
    echo "${m}m"
  fi
}
Progress Bars
Bash
bar() {
  local pct=$1 width=${2:-10}
  [ "$pct" -gt 100 ] && pct=100
  local filled=$(( pct * width / 100 ))
  local empty=$(( width - filled ))
  local b=""
  for ((i=0; i<filled; i++)); do b+="█"; done
  for ((i=0; i<empty; i++)); do b+="░"; done
  echo "$b"
}
Color-Coded Bars
Bash
fg() { printf "\033[38;5;%sm" "$1"; }
GREEN=142; YELLOW=172; RED=167

bar_color() {
  local pct=$1
  if [ "$pct" -lt 50 ]; then echo $GREEN
  elif [ "$pct" -lt 80 ]; then echo $YELLOW
  else echo $RED; fi
}
Gotchas
- Use printf "%b", not printf "%s" — %s doesn't interpret ANSI escape codes. Your status line will show raw \033[38;5;142m text.
- No Nerd Font glyphs — The status line renderer doesn't support Powerline symbols (\ue0b0). Stick to plain text separators like |.
- GIT_OPTIONAL_LOCKS=0 — Always use this for git commands in the status line. Without it, concurrent git operations can block on lock files and freeze your status bar.
- jq is required — The script depends on jq for JSON parsing. Make sure it's installed.
- The context window size may surprise you — Even with 1M context configured in settings, the API may report 200k depending on the model and backend.
The Full Script
Bash
#!/usr/bin/env bash
input=$(cat)

# Extract fields
dir=$(echo "$input" | jq -r '.workspace.current_dir // .cwd // ""')
model=$(echo "$input" | jq -r '.model.display_name // ""')
model_id=$(echo "$input" | jq -r '.model.id // ""')
ctx_pct=$(echo "$input" | jq -r '.context_window.used_percentage // 0')
ctx_size=$(echo "$input" | jq -r '.context_window.context_window_size // 0')
duration_ms=$(echo "$input" | jq -r '.cost.total_duration_ms // 0')
cost_usd=$(echo "$input" | jq -r '.cost.total_cost_usd // 0')
rl_5h_pct=$(echo "$input" | jq -r '.rate_limits.five_hour.used_percentage // 0')
rl_5h_reset=$(echo "$input" | jq -r '.rate_limits.five_hour.resets_at // 0')
rl_7d_pct=$(echo "$input" | jq -r '.rate_limits.seven_day.used_percentage // 0')
rl_7d_reset=$(echo "$input" | jq -r '.rate_limits.seven_day.resets_at // 0')

# Mode detection
mode="Max"
case "$model_id" in
  *sonnet*) mode="Sonnet" ;;
  *haiku*)  mode="Haiku" ;;
esac

# Context size label
ctx_label="200k"
if [ "$ctx_size" -ge 1000000 ] 2>/dev/null; then ctx_label="1M"
elif [ "$ctx_size" -ge 200000 ] 2>/dev/null; then ctx_label="200k"
fi

# Directory + git
dir="${dir/#$HOME/~}"
short_dir=$(echo "$dir" | awk -F'/' '{ if (NF>3) print ".../"$(NF-2)"/"$(NF-1)"/"$NF; else print $0 }')
real_dir="${dir/#~/$HOME}"

git_info=""
if GIT_OPTIONAL_LOCKS=0 git -C "$real_dir" rev-parse --git-dir >/dev/null 2>&1; then
  branch=$(GIT_OPTIONAL_LOCKS=0 git -C "$real_dir" symbolic-ref --short HEAD 2>/dev/null)
  dirty=""
  [ -n "$(GIT_OPTIONAL_LOCKS=0 git -C "$real_dir" status --porcelain 2>/dev/null | head -1)" ] && dirty="*"
  [ -n "$branch" ] && git_info="git:(${branch}${dirty})"
fi

# Helpers
bar() {
  local pct=$1 w=${2:-10}; [ "$pct" -gt 100 ] && pct=100
  local f=$((pct*w/100)) e=$((w-f)) b=""
  for ((i=0;i<f;i++)); do b+="█"; done
  for ((i=0;i<e;i++)); do b+="░"; done
  echo "$b"
}
fmt_reset() {
  local d=$(( $1 - $(date +%s) )); [ "$d" -lt 0 ] && d=0
  local h=$((d/3600)) m=$(((d%3600)/60))
  [ $h -gt 0 ] && echo "${h}h ${m}m" || echo "${m}m"
}
fmt_dur() {
  local s=$(($1/1000)) h=$((s/3600)) m=$(((s%3600)/60))
  [ $h -gt 0 ] && echo "${h}h ${m}m" || echo "${m}m"
}

# Colors (Gruvbox)
fg() { printf "\033[38;5;%sm" "$1"; }
bold="\033[1m"; rst="\033[0m"
YELLOW=172; AQUA=65; GREEN=142; RED=167; WHITE=255; DIM=241; PURPLE=132
bar_c() { [ "$1" -lt 50 ] && echo $GREEN || { [ "$1" -lt 80 ] && echo $YELLOW || echo $RED; }; }

# Counts
cmc=$(find "$real_dir" -maxdepth 3 -name "CLAUDE.md" 2>/dev/null | wc -l | tr -d ' ')
mc=$(echo "$input" | jq '[.mcp_servers//{}|keys[]]|length' 2>/dev/null)
hc=$(jq '[.hooks//{}|to_entries[]|.value[].hooks[]?]|length' ~/.claude/settings.json 2>/dev/null)

# Output
printf "%b" "$(fg $YELLOW)${bold}[${model} (${ctx_label} context) | ${mode}]${rst}  $(fg $DIM)|${rst}  $(fg $GREEN)${bold}${short_dir}${rst}"
[ -n "$git_info" ] && printf "%b" " $(fg $AQUA)${git_info}${rst}"
printf "\n"

ci=$(printf "%.0f" "$ctx_pct")
printf "%b" "$(fg $DIM)Context $(fg $(bar_c $ci))$(bar $ci 10) $(fg $WHITE)${bold}${ci}%${rst}"
printf "%b" "  $(fg $DIM)|${rst}  $(fg $DIM)Usage $(fg $(bar_c $rl_5h_pct))$(bar $rl_5h_pct 10) $(fg $WHITE)${bold}${rl_5h_pct}%${rst} $(fg $DIM)(resets $(fmt_reset $rl_5h_reset))${rst}"
printf "%b" "  $(fg $DIM)|${rst}  $(fg $(bar_c $rl_7d_pct))$(bar $rl_7d_pct 8) $(fg $WHITE)${bold}${rl_7d_pct}%${rst} $(fg $DIM)(resets $(fmt_reset $rl_7d_reset))${rst}\n"

printf "%b" "$(fg $DIM)${cmc} CLAUDE.md | ${mc} MCPs | ${hc} hooks | $(fmt_dur $duration_ms) | \$$(printf '%.2f' "$cost_usd")${rst}\n"
Bash
chmod +x ~/.claude/statusline-command.sh
Json
{
  "statusLine": {
    "type": "command",
    "command": "bash ~/.claude/statusline-command.sh"
  }
}
Let AI Do It
Bash
I want a custom Claude Code status line that shows:
- Model name, context window size, and mode (Max/Sonnet)
- Current directory with git branch and dirty indicator
- Context usage with a color-coded progress bar
- 5-hour and 7-day rate limit usage with reset countdowns
- Session duration and cost
- CLAUDE.md count, MCP server count, hook count

Reference: https://mjshao.fun/blog/claude-code-statusline

Use Gruvbox Dark colors. The status line JSON input includes
rate_limits.five_hour and rate_limits.seven_day fields.
Put the script at ~/.claude/statusline-command.sh and configure
settings.json accordingly.
Claude Code 有一个隐藏的状态栏功能。它会把丰富的 JSON 数据通过 stdin 传给你的脚本——包括限速信息、上下文用量和会话费用。我把它做成了一个 Gruvbox 风格的仪表盘。
没人提的功能
Json
{
  "statusLine": {
    "type": "command",
    "command": "bash ~/.claude/statusline-command.sh"
  }
}
JSON 输入
Json
{
  "context_window": {
    "used_percentage": 35,
    "context_window_size": 200000
  },
  "rate_limits": {
    "five_hour": {
      "used_percentage": 81,
      "resets_at": 1774872000
    },
    "seven_day": {
      "used_percentage": 6,
      "resets_at": 1775458800
    }
  },
  "cost": {
    "total_cost_usd": 2.25,
    "total_duration_ms": 5019860
  },
  "model": {
    "display_name": "Opus 4.6",
    "id": "claude-opus-4-6"
  }
}
最终效果
Text
[Opus 4.6 (200k context) | Max]  |  ~/project git:(main*)
Context ████░░░░░░ 35%  |  Usage ████████░░ 81% (resets 2h 40m)  |  ░░░░░░░░ 6% (resets 6d 3h)
3 CLAUDE.md | 4 MCPs | 10 hooks | 1h 23m | $2.25
- Context:上下文窗口用了多少
- 5h Usage:5 小时滚动限速(真正会限速你的那个)
- 7d Usage:7 天滚动限速
踩过的坑
- 用 printf "%b",不要用 printf "%s" — %s 不解析 ANSI 转义码,状态栏会显示原始的 \033[38;5;142m。
- 不支持 Nerd Font 字符 — 状态栏渲染器不认 Powerline 符号(\ue0b0)。老老实实用 | 分隔。
- GIT_OPTIONAL_LOCKS=0 — git 命令必须加这个。不然并发 git 操作会锁文件,卡死状态栏。
- 需要 jq — 脚本用 jq 解析 JSON,确保装了。
- context window 大小可能出乎意料 — 就算 settings 里配了 1M,API 返回的可能是 200k,取决于模型和后端。
完整脚本
让 AI 帮你搞定
Bash
我想要一个自定义的 Claude Code 状态栏,显示:
- 模型名称、上下文大小、模式(Max/Sonnet)
- 当前目录 + git 分支和脏状态
- 上下文用量进度条(带颜色)
- 5 小时和 7 天限速用量 + 重置倒计时
- 会话时长和费用
- CLAUDE.md 数量、MCP 服务器数、Hook 数

参考:https://mjshao.fun/blog/claude-code-statusline

用 Gruvbox Dark 配色。状态栏 JSON 里有 rate_limits.five_hour
和 rate_limits.seven_day 字段。
脚本放在 ~/.claude/statusline-command.sh,配好 settings.json。